Original Link: https://www.anandtech.com/show/4879/ocz-zdrive-r4-cm88-16tb-pcie-ssd-review
OCZ Z-Drive R4 CM88 (1.6TB PCIe SSD) Review
by Anand Lal Shimpi on September 27, 2011 2:02 PM EST- Posted in
- Storage
- SSDs
- OCZ
- Z-Drive R4
- PCIe SSD
In our last SandForce SSD roundup I talked about how undesirable the consumer SSD market is, at least for those companies who don't produce their own controllers and/or NAND. There's a downward trend in NAND and SSD pricing, which unfortunately squeezes drive manufacturers as they compete for marketshare. The shrinking margins in the consumer SSD space will ultimately drive companies out of the business, consolidating power in those companies who are fine operating with slim margins. There are other effects, such as insufficient validation testing that result from this price crunch.
Public companies are under an even greater pressure to maintain high profit margins. Investors don't care about good product, they care about good returns. What is a public SSD manufacturer like OCZ to do? Go after the enterprise market of course.
OCZ has quietly addressed the enterprise SSD space for a while now. Today you can custom order an OCZ Deneva 2 SSD which is an enterprise focused SF-2000 based solution. OCZ's enterprise drives are fully customizable down to the controller, firmware and NAND type on-board. If you want an SF-2000 drive with SAS support and SLC NAND, OCZ will build it for you.
In the enterprise segment where 1U and 2U servers are common, PCI Express SSDs are very attractive. You may not always have a ton of 2.5" drive bays but there's usually at least one high-bandwidth PCIe slot unused. The RevoDrive family of PCIe SSDs were targeted at the high-end desktop or workstation market, but for an enterprise-specific solution OCZ has its Z-Drive line.
We introduced the Z-Drive R4 in our Computex coverage earlier this year - it's a beast. The Z-Drive R4 is a multi-controller PCIe solution that uses either 4 or 8 SF-2000 controllers behind a SAS-to-PCIe 2.0 x8 controller. The breakdown is as follows:
| OCZ Z-Drive R4 Lineup | ||||||
| CM84 | CM88 | RM84 | RM88 | |||
| Capacities | 300/600/1200GB | 800/1600/3200GB | 300/600/1200GB | 800/1600/3200GB | ||
| NAND | MLC | MLC | MLC | MLC | ||
| Interface | PCIe Gen 2 x8 | PCIe Gen 2 x8 | PCIe Gen 2 x8 | PCIe Gen 2 x8 | ||
| Form Factor | Half Height PCIe | Full Height PCIe | Half Height PCIe | Full Height PCIe | ||
| Dimensions LxWxH | 168.55 x 68.91 x 17.14 mm | 242 x 98.4 x 17.14mm | 168.55 x 68.91 x 17.14 mm | 242 x 98.4 x 17.14mm | ||
| SSD Controllers | 4 x SF-2282 | 8 x SF-2282 | 4 x SF-2582 | 8 x SF-2582 | ||
| Power Failure Protection | N | N | Y | Y | ||
| Max Read | 2000MB/s | 2800MB/s | 2000MB/s | 2800MB/s | ||
| Max Write | 2000MB/s | 2800MB/s | 2000MB/s | 2800MB/s | ||
| Max Random Read | 250K IOPS | 410K IOPS | 250K IOPS | 410K IOPS | ||
| Max Random Write | 160K IOPS | 275K IOPS | 160K IOPS | 275K IOPS | ||
The xM84s are half height solutions with four controllers while the xM88s are full height with eight controllers. The C-series use SF-2282 controllers while the R-series use SF-2582. The main difference there is the support for power failure protection. The R-series boards have an array of capacitors that can store enough charge to flush all pending writes to the NAND arrays in the event of a power failure. The C-series boards do not have this feature.
Despite the spec table above, OCZ also offers customized solutions as I mentioned above. The table above simply highlights the standard configurations OCZ builds.
For today's review OCZ sent us a 1.6TB Z-Drive R4 CM88. We have a preproduction board that has a number of stability & compatibility issues. OCZ tells us these problems will be addressed in the final version of the drives due to ship in the coming weeks. OCZ expects pricing on this board to be somewhere in the $6 - $7/GB range depending on configuration. Doing the math that works out to be anywhere between $9600 - $11200 for this single SSD. OCZ typically sells SF-2281 based SSDs at around $2/GB, even accounting for the extra controllers on-board there should be a hefty amount of profit for OCZ in the selling price of these Z-drives.
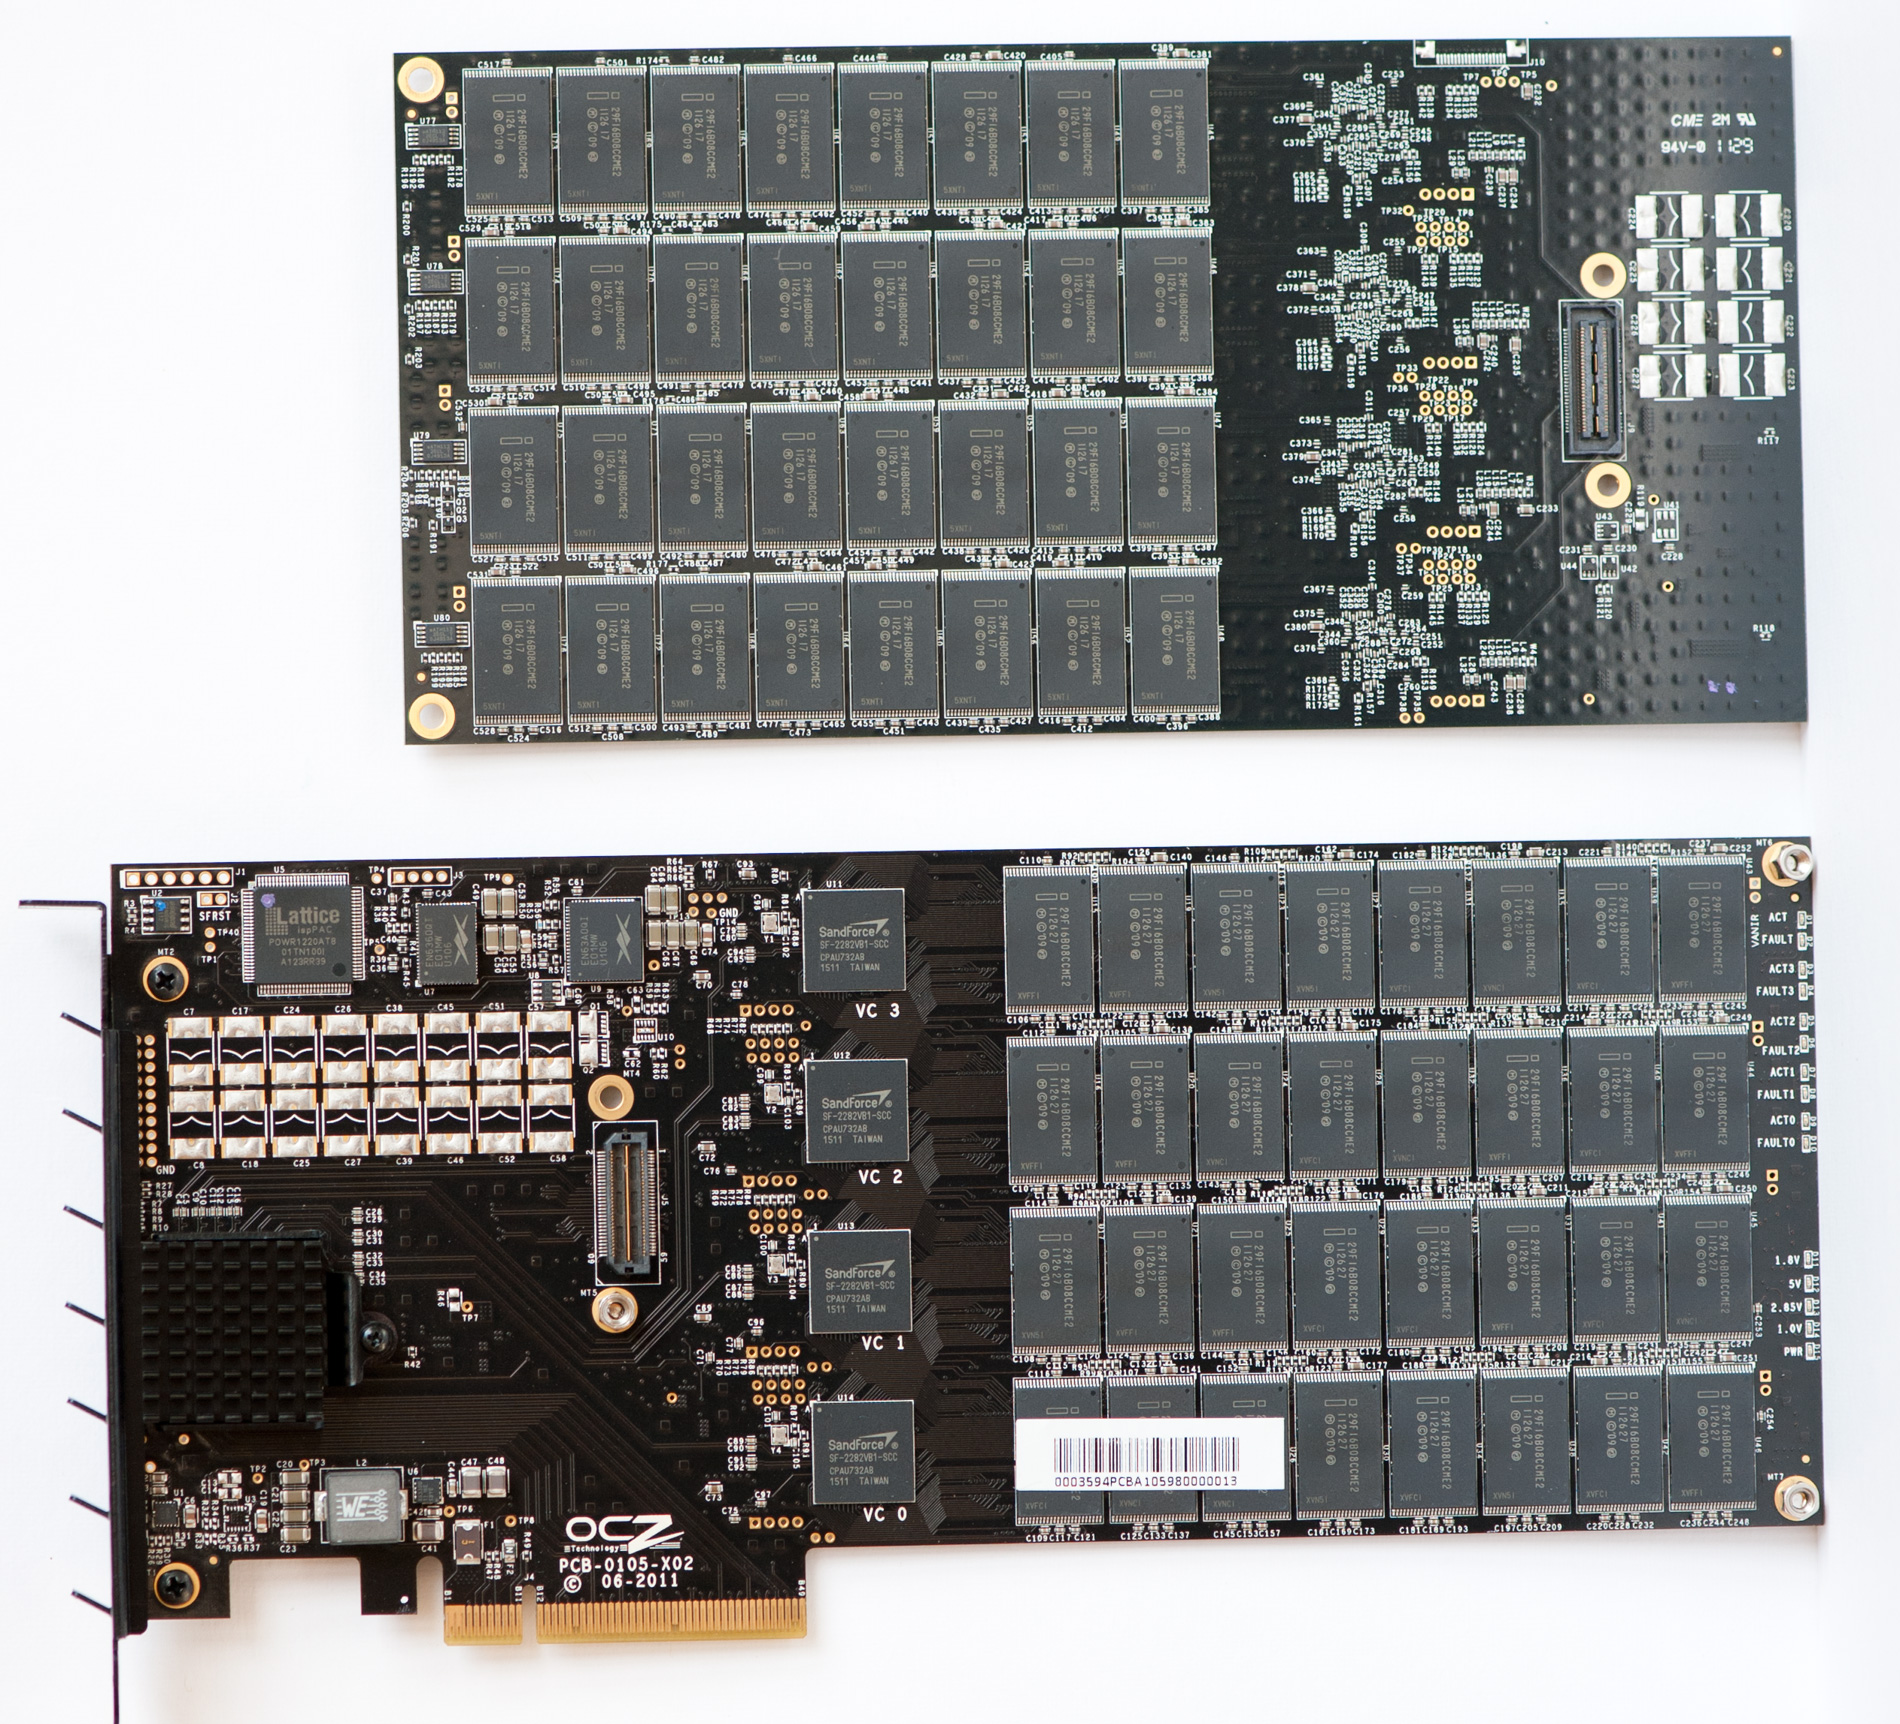
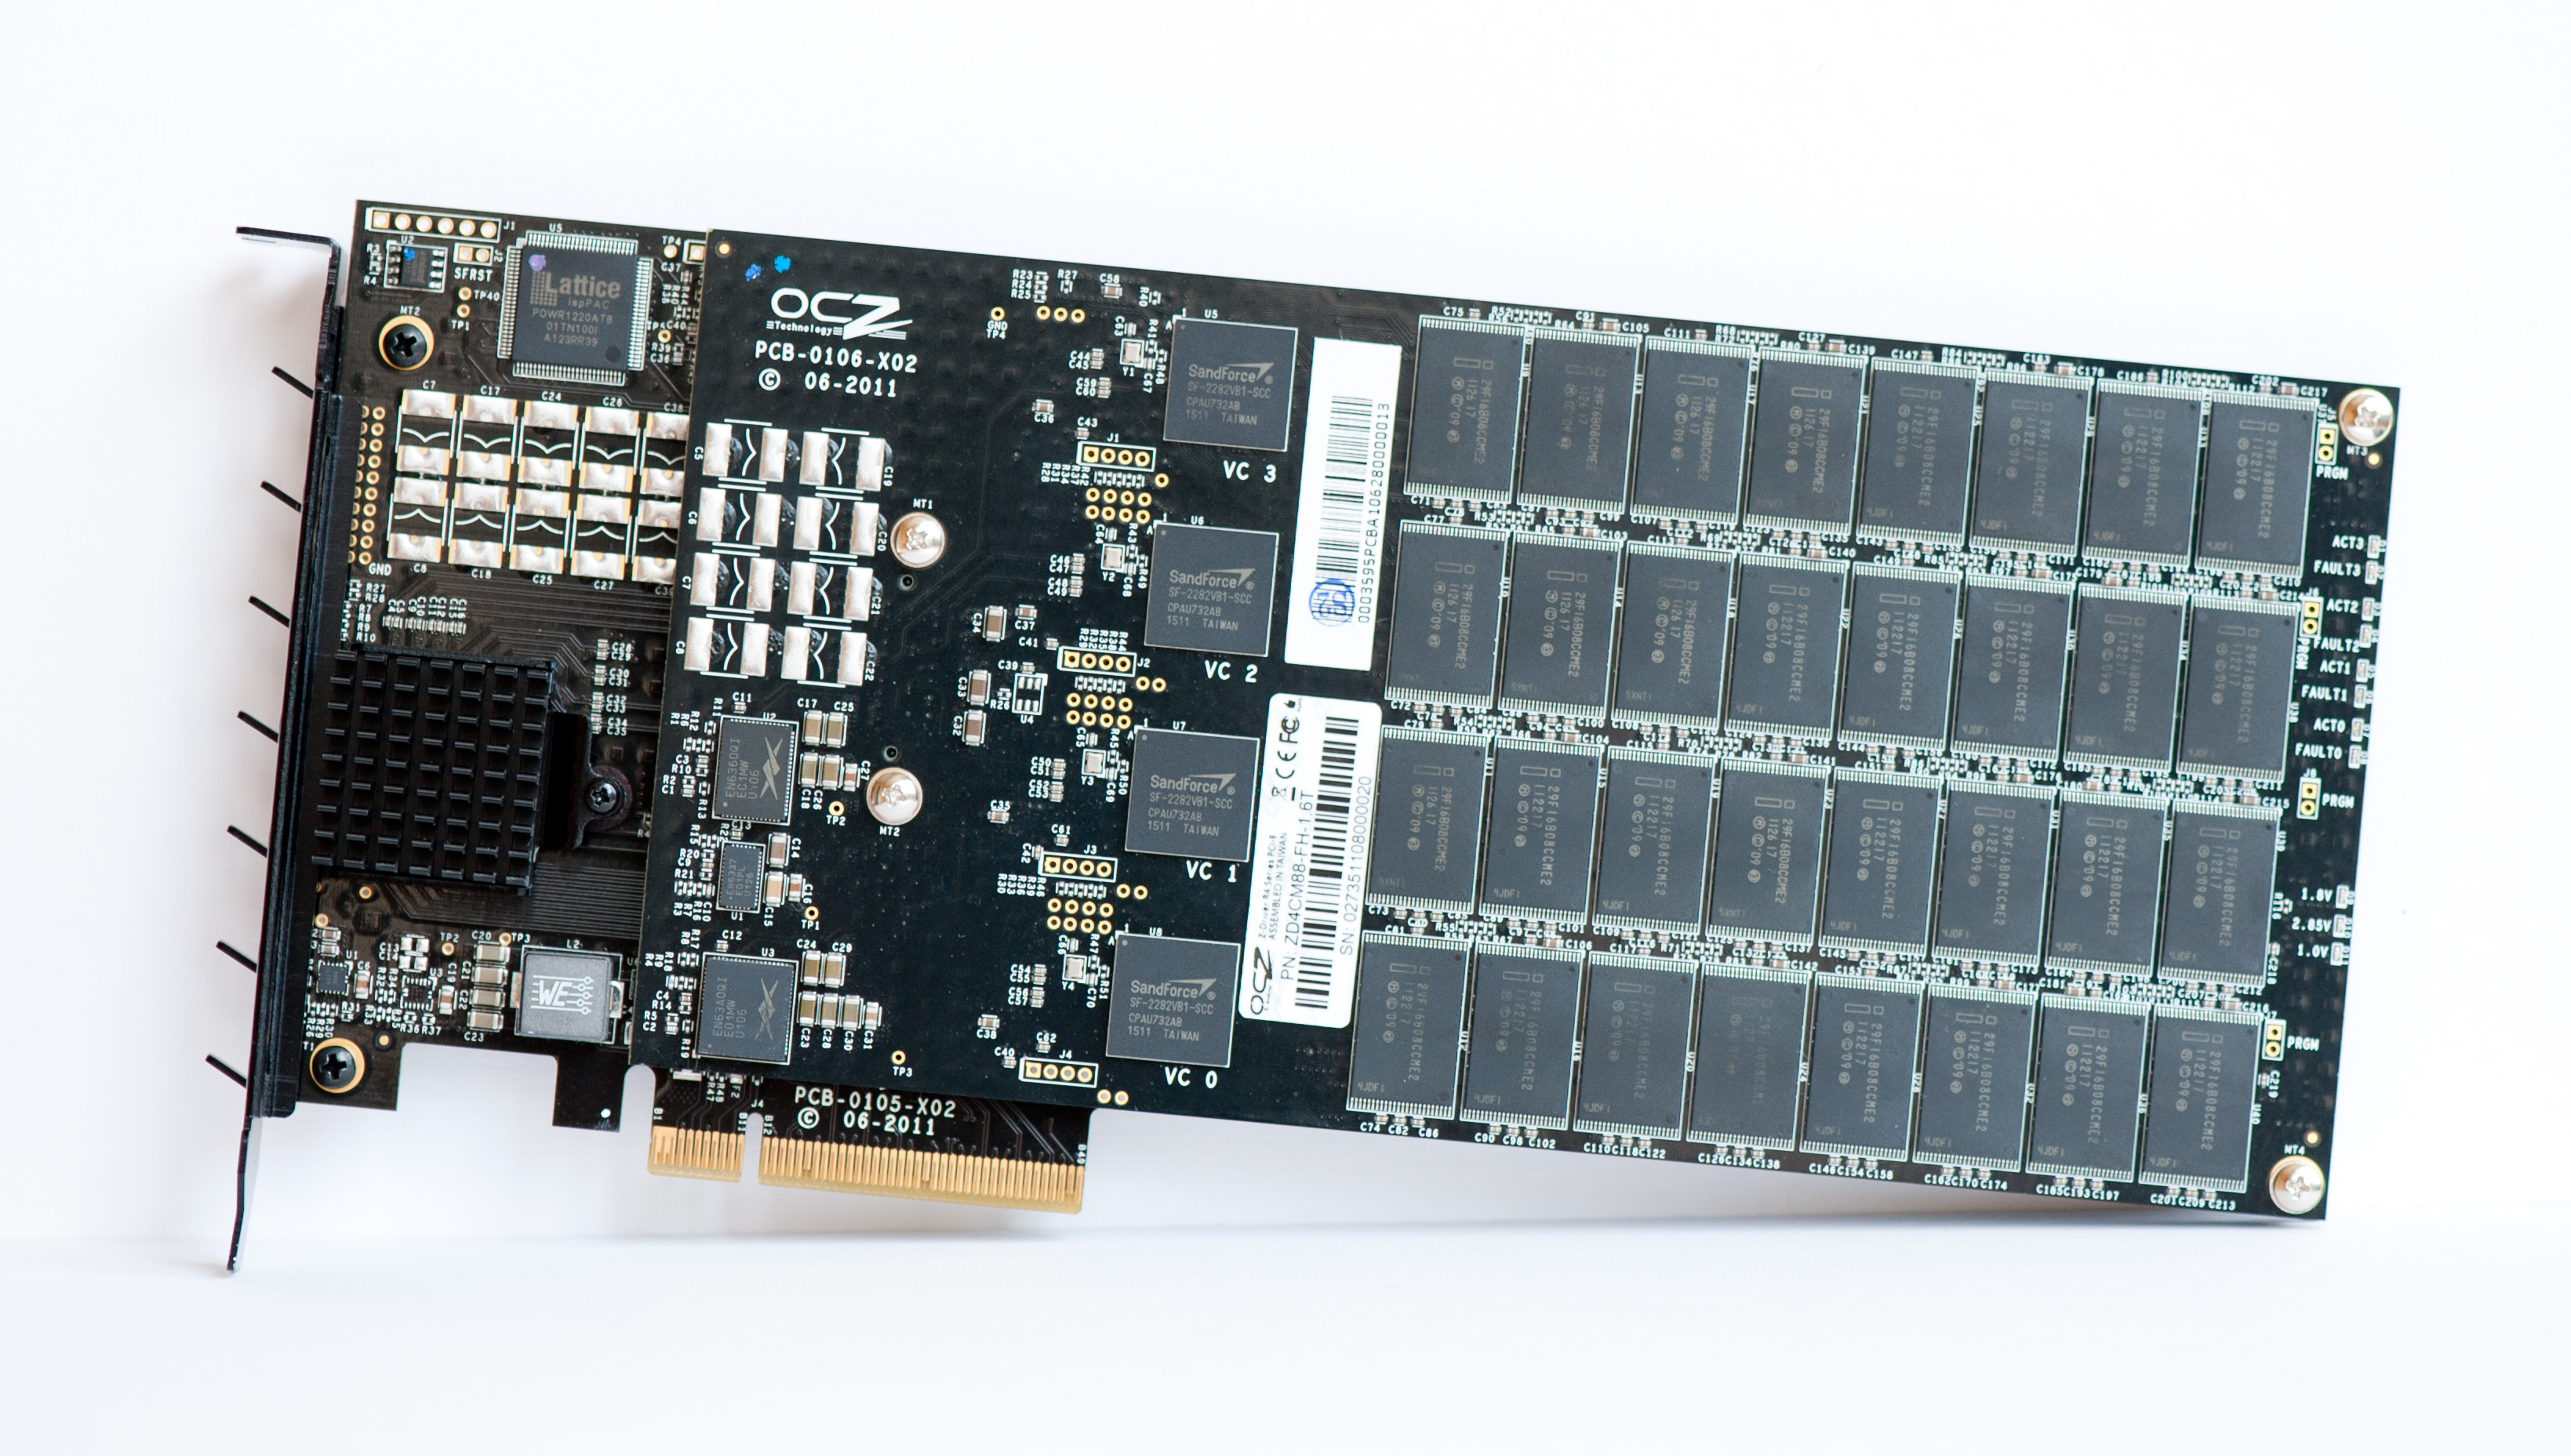
As with the RevoDrive X2 models the Z-Drive R4 CM88 uses two PCBs to accommodate all of its controllers. Each PCB is home to four SF-2282 controllers and 64 Intel 25nm MLC NAND devices (8 controllers, 128 devices total). Each NAND device has two 8GB die inside, which works out to be 2048GB of NAND on-board. This is an absolutely insane amount of NAND for a single drive. Remember each 8GB MLC NAND die (25nm) is 167mm2, which means this Z-Drive R4 has 42752mm2 of 25nm silicon on-board. A single 300mm wafer only has a surface area of 70685mm2 (even less is usable), which means it takes more than half of a 300mm 25nm MLC NAND wafer to supply the flash for just one of these drives. Roughly 27% of the NAND is set aside as spare area, exposing 1490GiB to the OS.
Thanks to the eight SF-2282 controllers and tons of NAND in close proximity, OCZ requires 100 CFM of air to properly cool the Z-Drive R4. This is clearly a solution for a rack mounted server.
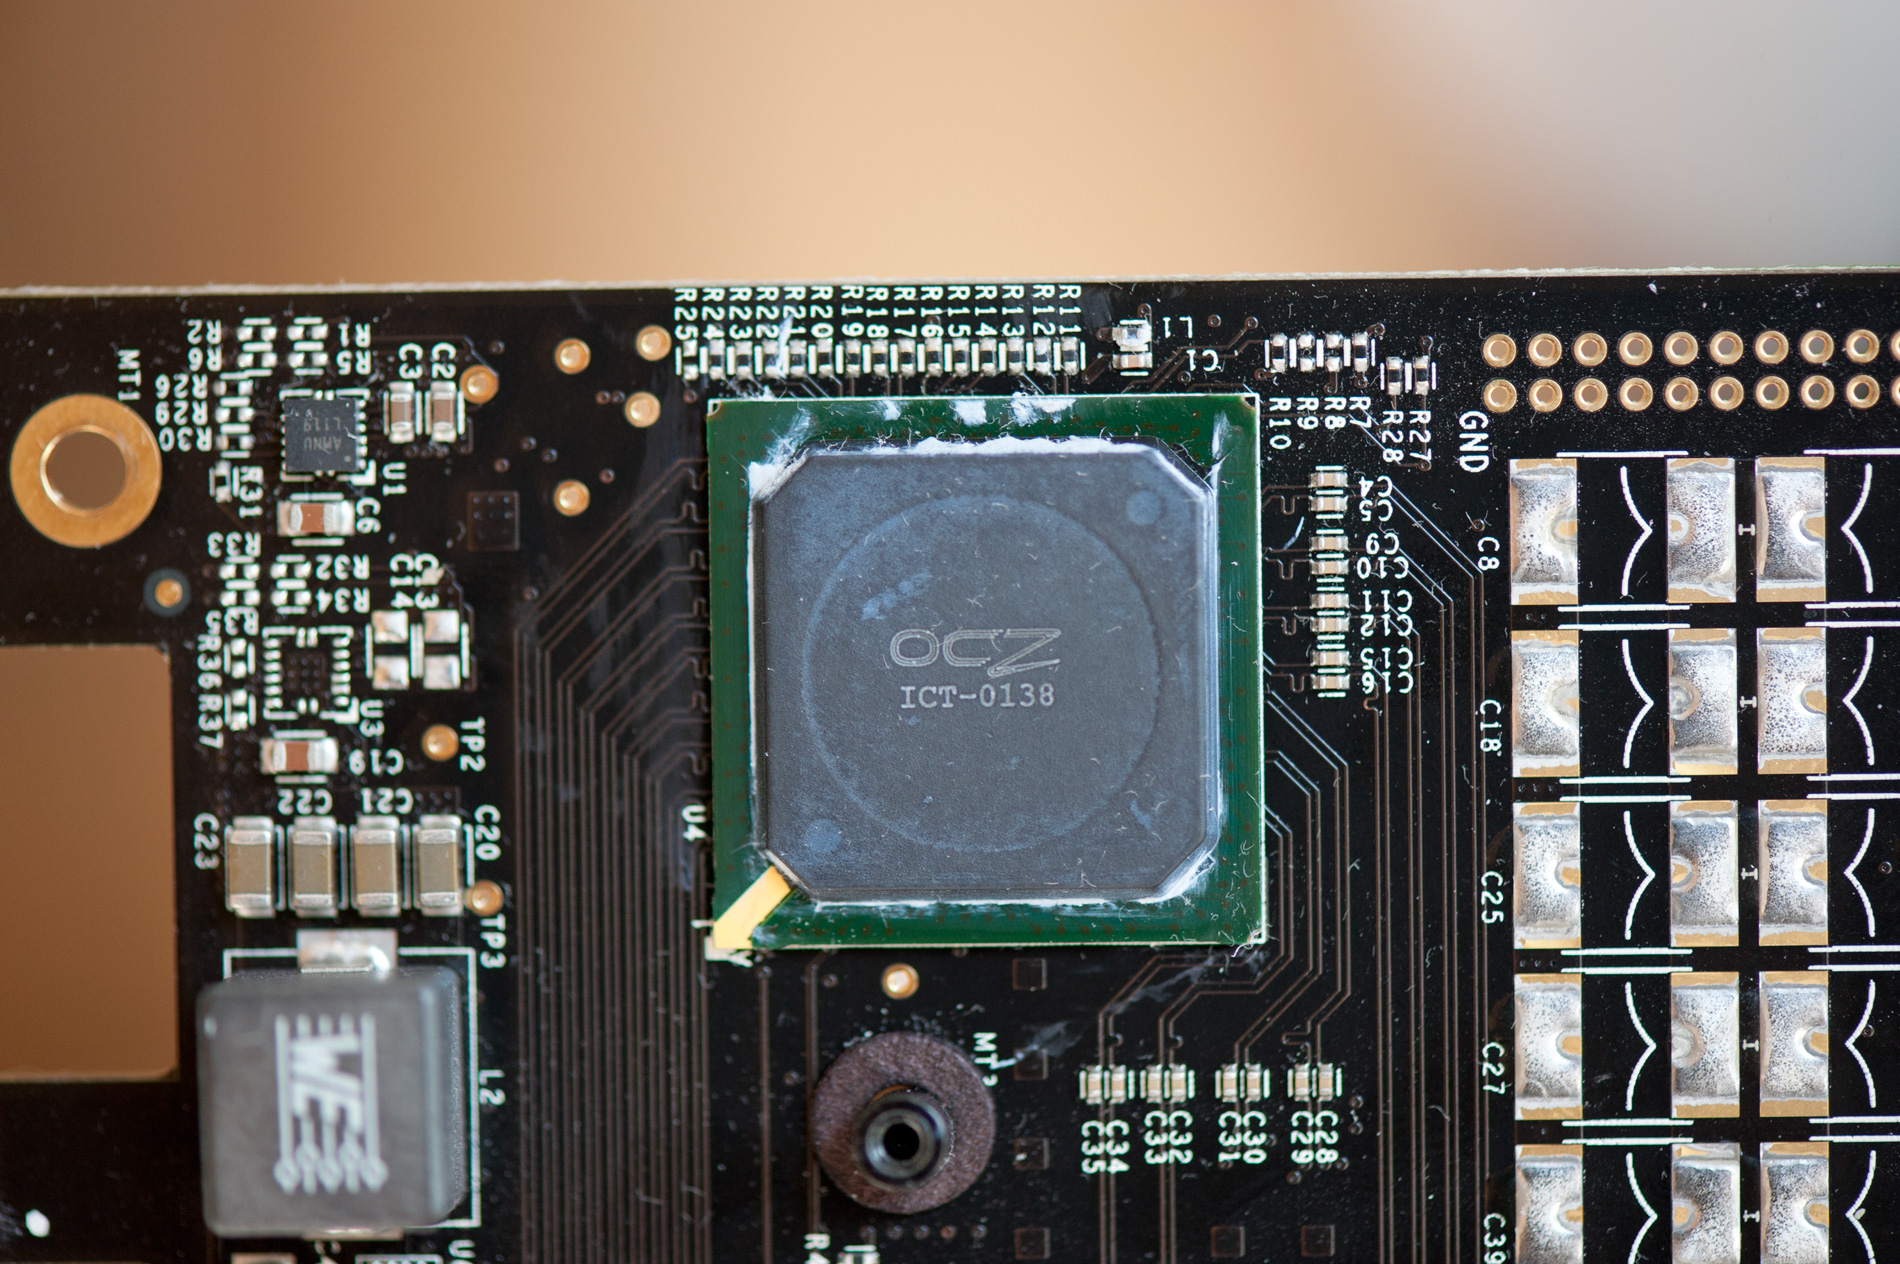
It's OCZ branded but this is a Marvell SAS controller - the same driver works on the RevoDrive 3 X2 and the Z-Drive R4
OCZ continues to use its VCA 2.0 architecture on the Z-Drive R4. Details are still vague but OCZ claims to have written its own driver and firmware for the Marvell SAS controller on the Z-Drive R4 that allows it to manage redirection of IOs based on current controller queue depths rather than a dumb RAID-stripe. The driver accumulates IOs and redestributes them to the drive's controller array, to some degree, dynamically. OCZ's VCA also allows TRIM to be passed to the array although Microsoft's OSes won't pass TRIM to SCSI/SAS drives. You can use OCZ's Toolbox to secure erase the drive but there's no real-time TRIM available, this is a Microsoft limitation that impacts all SAS based drives.
The Test
This is going to be a bit of a disappointing set of performance graphs as it is our first real foray into the world of enterprise SSD testing. You will see results from the RevoDrive 3 X2 as well as a single Vertex 3 and Intel's X25-E, however we have no other high-end PCIe SSDs at our disposal for comparison. We have put in a request to FusionIO for a competing solution however it appears to have fallen on deaf ears. We will use this review to begin assembling our enterprise SSD data and hopefully in the coming weeks and months we'll be able to have a set equivalent to what we have in the consumer space.
We also had to run the Z-Drive R4 on our old X58 testbed instead of our H67 system as it wouldn't complete any tests on our H67 platform. OCZ attributes this to an issue with the preproduction Z-Drive boards which it says will be corrected by the time mass production begins.
| CPU |
Intel Core i7 965 running at 3.2GHz (Turbo & EIST Disabled) for Enterprise Bench Intel Core i7 2600K running at 3.4GHz (Turbo & EIST Disabled) - for AT SB 2011, AS SSD & ATTO |
| Motherboard: |
Intel DX58SO (Intel X58) Intel H67 Motherboard |
| Chipset: |
Intel X58 Intel H67 |
| Chipset Drivers: |
Intel 9.1.1.1015 + Intel RST 10.2 |
| Memory: | Qimonda DDR3-1333 4 x 1GB (7-7-7-20) |
| Video Card: | eVGA GeForce GTX 285 |
| Video Drivers: | NVIDIA ForceWare 190.38 64-bit |
| Desktop Resolution: | 1920 x 1200 |
| OS: | Windows 7 x64 |
Random Read/Write Speed
The four corners of SSD performance are as follows: random read, random write, sequential read and sequential write speed. Random accesses are generally small in size, while sequential accesses tend to be larger and thus we have the four Iometer tests we use in all of our reviews.
Our first test writes 4KB in a completely random pattern over an 8GB space of the drive to simulate the sort of random access that you'd see on an OS drive (even this is more stressful than a normal desktop user would see). I perform three concurrent IOs and run the test for 3 minutes. The results reported are in average MB/s over the entire time. We use both standard pseudo randomly generated data for each write as well as fully random data to show you both the maximum and minimum performance offered by SandForce based drives in these tests. The average performance of SF drives will likely be somewhere in between the two values for each drive you see in the graphs. For an understanding of why this matters, read our original SandForce article.
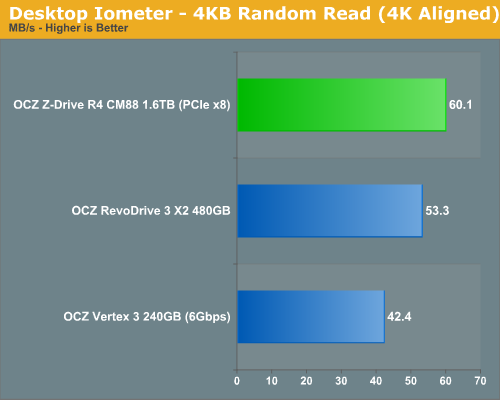
As we saw in our RevoDrive 3 X2 review, low queue depth random read performance doesn't really show much of an advantage on these multi-controller PCIe RAID SSDs. The Z-Drive R4 comes in a little faster than the RevoDrive 3 X2 but not by much at all. Even a single Vertex 3 does just fine here.
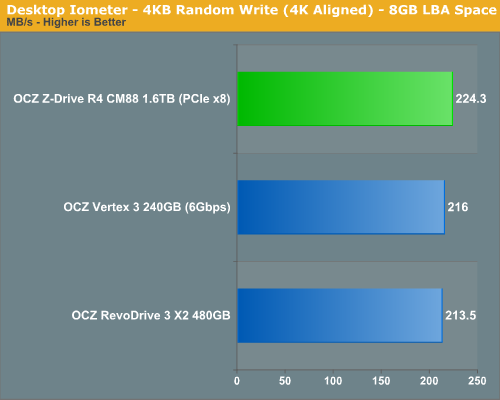
Random write performance tells a similar story, at such low queue depths most of the controllers aren't doing any work at all. Let's see what happens when we start ramping up queue depth however:
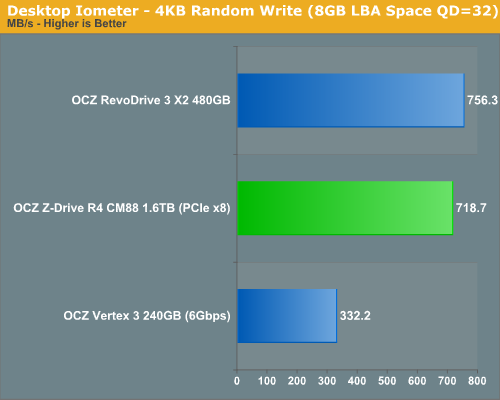
Surprisingly enough, even at a queue depth of 32 the Z-Drive R4 is no faster than the RevoDrive 3 X2. In fact, it's a bit slower (presumably due to the extra overhead of having to split the workload between 8 controllers vs just 4). In our RevoDrive review we ran a third random write test with two QD=32 threads in parallel, it's here that we can start to see a difference between these drives:
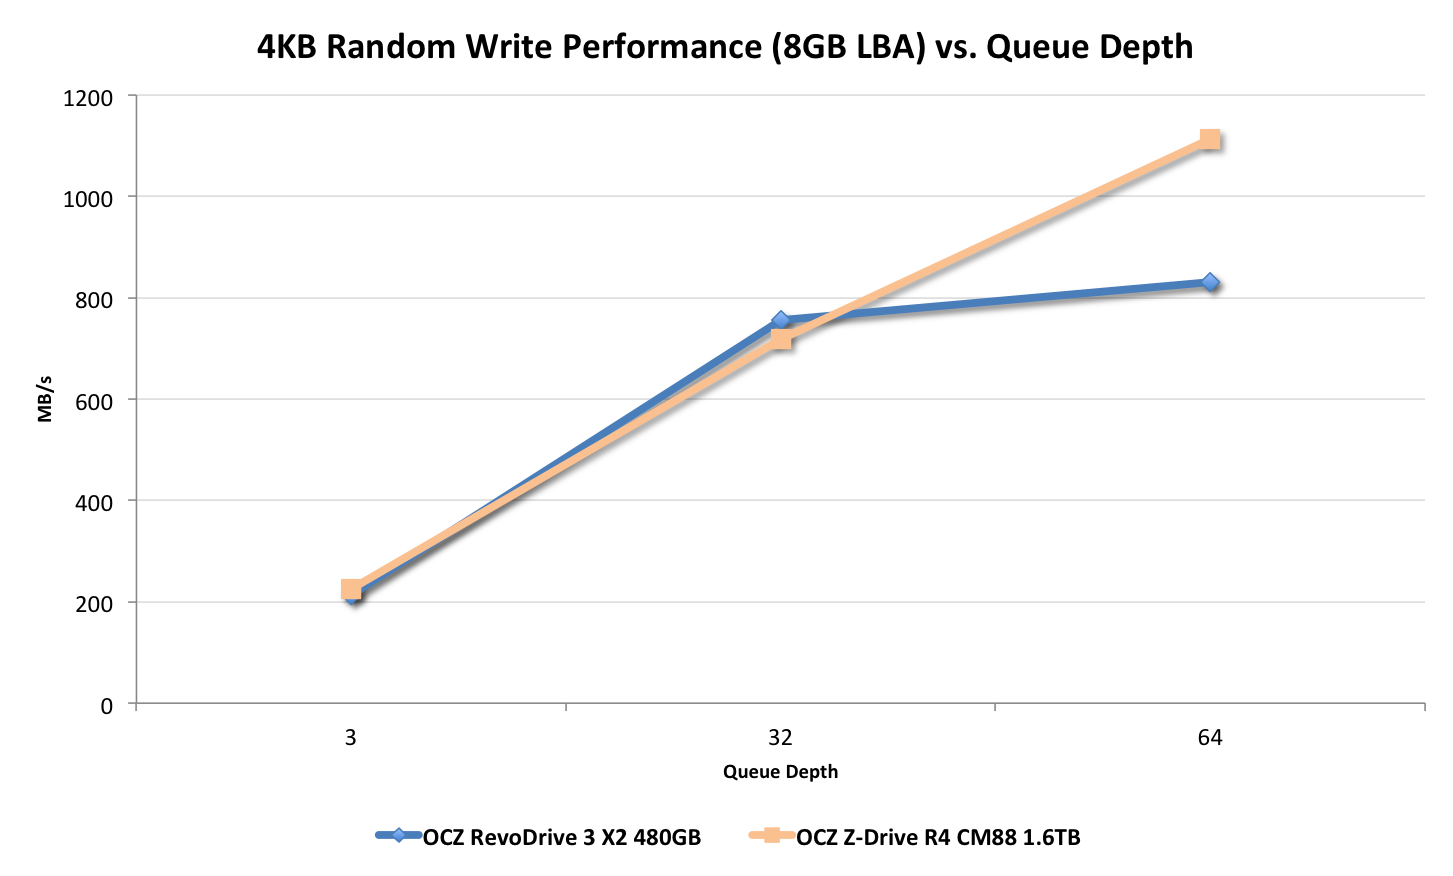
It's only at ultra high queue depths that the Z-Drive can begin to distance itself from the RevoDrive 3 X2. It looks like we may need some really stressful tests to tax this thing. The chart below represents the same data as above but in IOPS instead of MB/s:
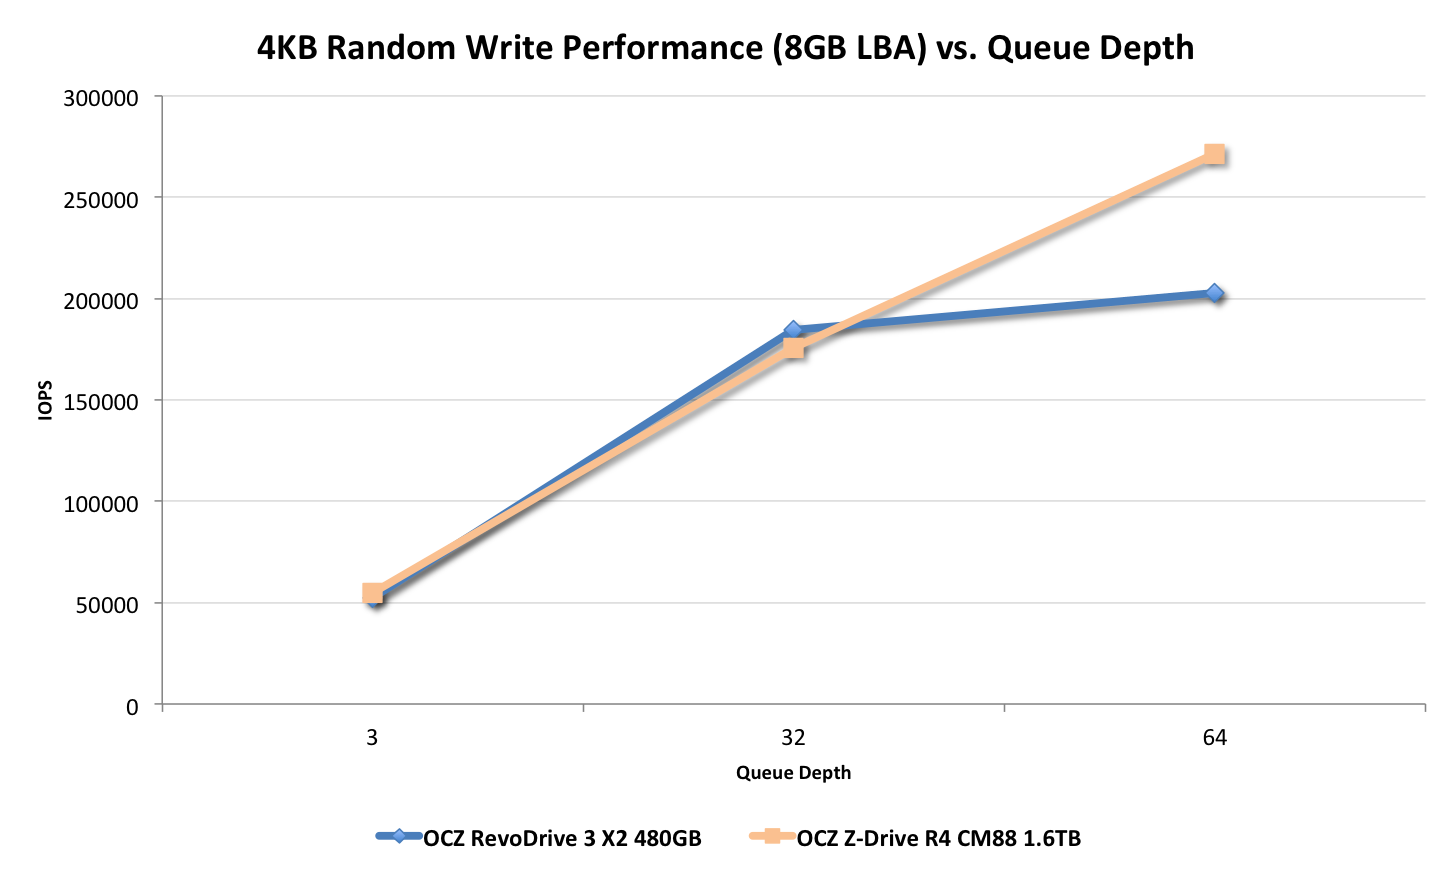
271K IOPS...not bad.
Sequential Read/Write Speed
To measure sequential performance I ran a 1 minute long 128KB sequential test over the entire span of the drive at a queue depth of 1. The results reported are in average MB/s over the entire test length. These results are going to be the best indicator of large file copy performance.
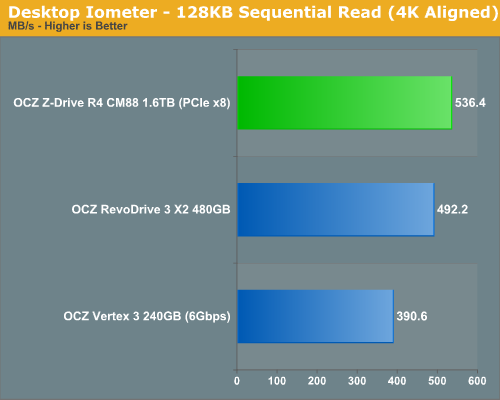
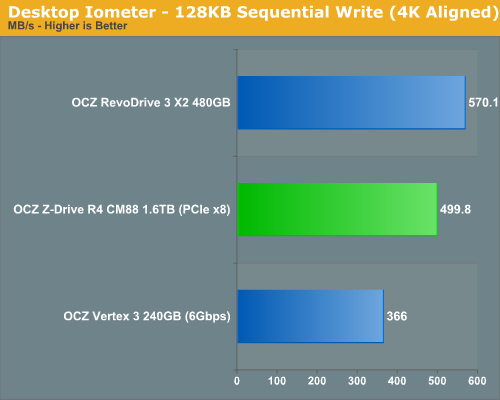
Again we see that low queue depth transfers don't stress the Z-Drive enough to flex its muscles.
Sequential Performance vs. Transfer Size (ATTO)
I stopped putting these charts in our reviews (although I do include the data in Bench) because they are generally difficult to read. Here we're only going to look at three drives though: a Vertex 3, RevoDrive 3 X2 and the Z-Drive R4 CM88:
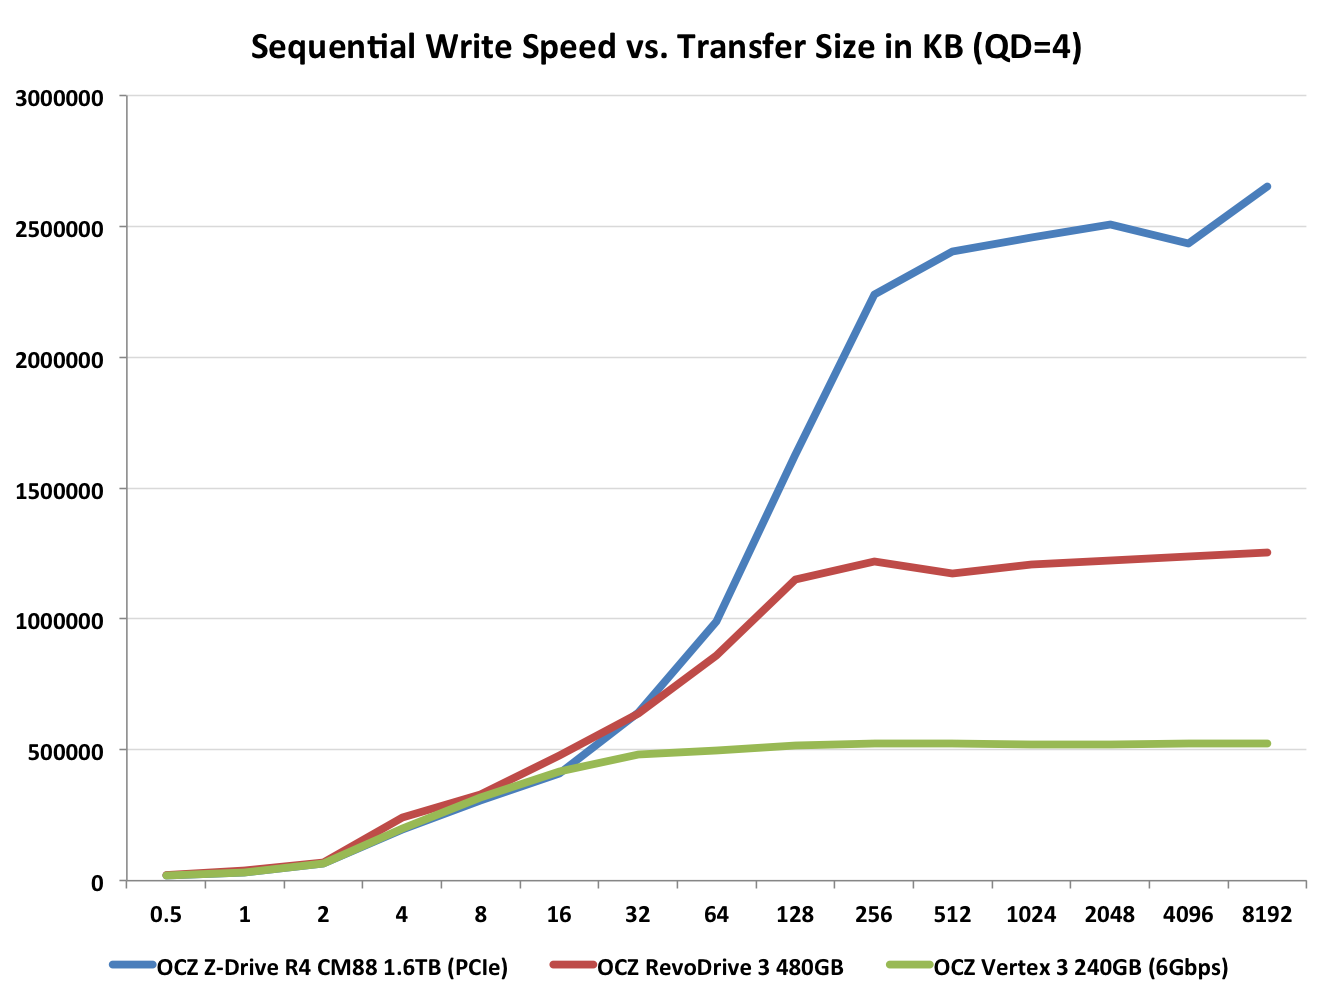
Now we're starting to see something. If you can't scale with queue depth, scaling up the transfer size seems to do the trick. After about 64KB the Z-Drive R4 starts to pull away fro the RevoDrive 3 X2, peaking at just over 2.5GB/s!
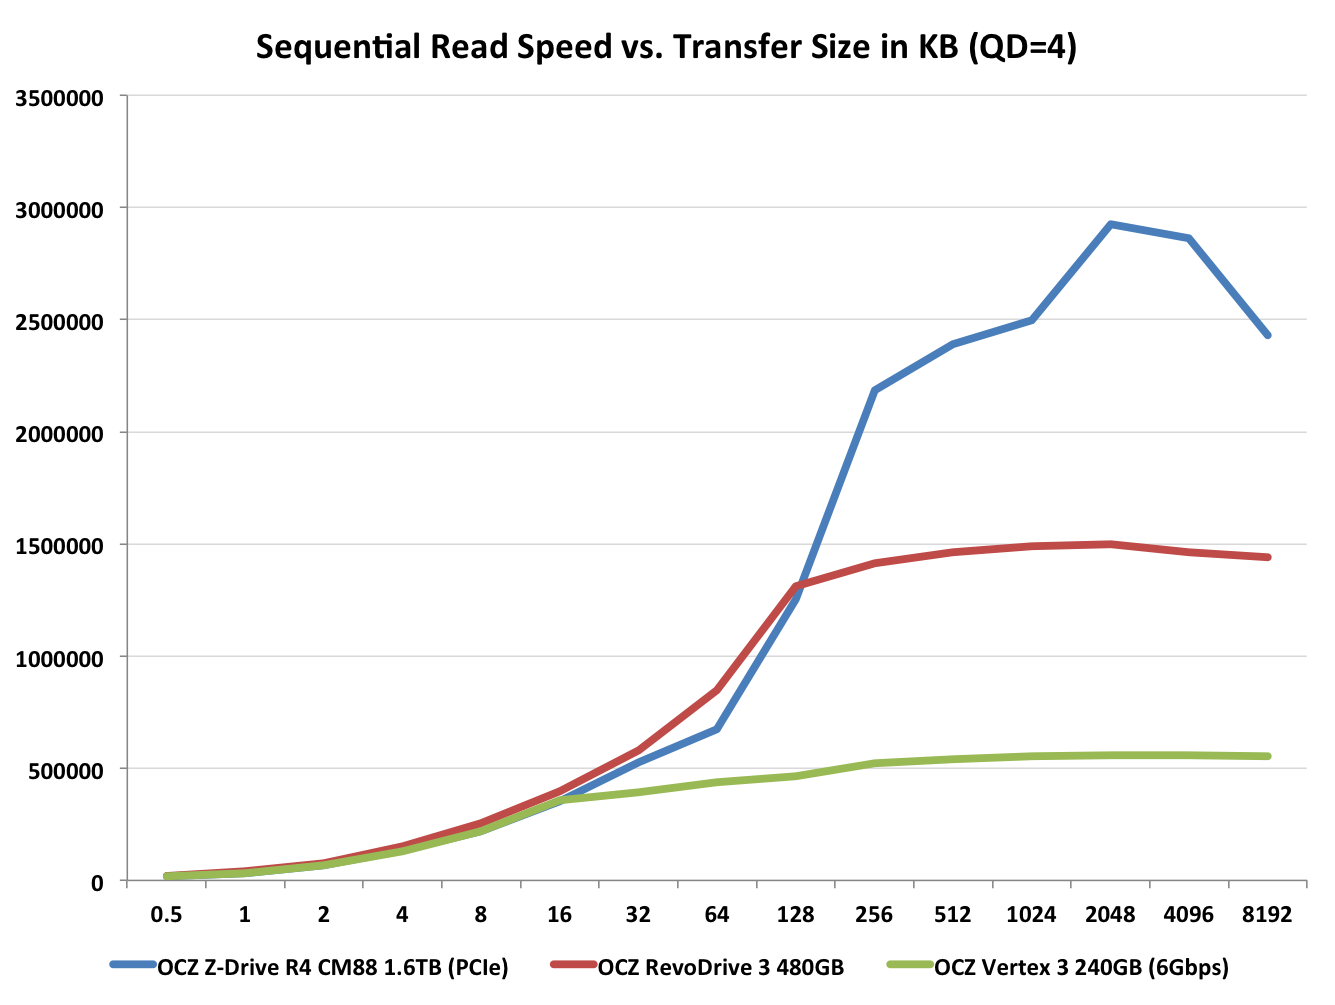
Read performance is even more impressive: the Z-Drive R4 manages just under 3GB/s for 2MB transfer sizes.
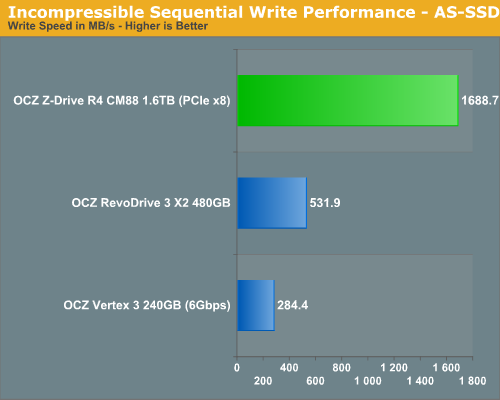
AS-SSD Incompressible Sequential Performance
The AS-SSD sequential benchmark uses incompressible data for all of its transfers. The result is a pretty big reduction in sequential write speed on SandForce based controllers.
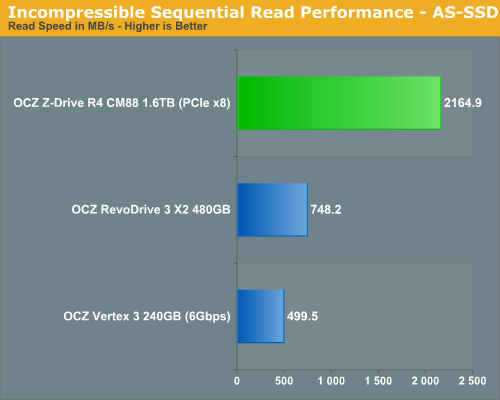
Throwing incompressible data at the controller is another way to get it to shine. With less data that can be thrown away, there's more parallelism to be exploited by the controllers. What results is huge performance - over 2GB/s in the read test and 1.6GB/s in the write test. Note that these scores are more than twice that of the RevoDrive 3 X2 - perhaps due to the use of asynchronous NAND in the RevoDrive 3 X2.
AnandTech Storage Bench 2011
Last year we introduced our AnandTech Storage Bench, a suite of benchmarks that took traces of real OS/application usage and played them back in a repeatable manner. I assembled the traces myself out of frustration with the majority of what we have today in terms of SSD benchmarks.
Although the AnandTech Storage Bench tests did a good job of characterizing SSD performance, they weren't stressful enough. All of the tests performed less than 10GB of reads/writes and typically involved only 4GB of writes specifically. That's not even enough exceed the spare area on most SSDs. Most canned SSD benchmarks don't even come close to writing a single gigabyte of data, but that doesn't mean that simply writing 4GB is acceptable.
Originally I kept the benchmarks short enough that they wouldn't be a burden to run (~30 minutes) but long enough that they were representative of what a power user might do with their system.
Not too long ago I tweeted that I had created what I referred to as the Mother of All SSD Benchmarks (MOASB). Rather than only writing 4GB of data to the drive, this benchmark writes 106.32GB. It's the load you'd put on a drive after nearly two weeks of constant usage. And it takes a *long* time to run.
1) The MOASB, officially called AnandTech Storage Bench 2011 - Heavy Workload, mainly focuses on the times when your I/O activity is the highest. There is a lot of downloading and application installing that happens during the course of this test. My thinking was that it's during application installs, file copies, downloading and multitasking with all of this that you can really notice performance differences between drives.
2) I tried to cover as many bases as possible with the software I incorporated into this test. There's a lot of photo editing in Photoshop, HTML editing in Dreamweaver, web browsing, game playing/level loading (Starcraft II & WoW are both a part of the test) as well as general use stuff (application installing, virus scanning). I included a large amount of email downloading, document creation and editing as well. To top it all off I even use Visual Studio 2008 to build Chromium during the test.
The test has 2,168,893 read operations and 1,783,447 write operations. The IO breakdown is as follows:
| AnandTech Storage Bench 2011 - Heavy Workload IO Breakdown | ||||
| IO Size | % of Total | |||
| 4KB | 28% | |||
| 16KB | 10% | |||
| 32KB | 10% | |||
| 64KB | 4% | |||
Only 42% of all operations are sequential, the rest range from pseudo to fully random (with most falling in the pseudo-random category). Average queue depth is 4.625 IOs, with 59% of operations taking place in an IO queue of 1.
Many of you have asked for a better way to really characterize performance. Simply looking at IOPS doesn't really say much. As a result I'm going to be presenting Storage Bench 2011 data in a slightly different way. We'll have performance represented as Average MB/s, with higher numbers being better. At the same time I'll be reporting how long the SSD was busy while running this test. These disk busy graphs will show you exactly how much time was shaved off by using a faster drive vs. a slower one during the course of this test. Finally, I will also break out performance into reads, writes and combined. The reason I do this is to help balance out the fact that this test is unusually write intensive, which can often hide the benefits of a drive with good read performance.
There's also a new light workload for 2011. This is a far more reasonable, typical every day use case benchmark. Lots of web browsing, photo editing (but with a greater focus on photo consumption), video playback as well as some application installs and gaming. This test isn't nearly as write intensive as the MOASB but it's still multiple times more write intensive than what we were running last year.
As always I don't believe that these two benchmarks alone are enough to characterize the performance of a drive, but hopefully along with the rest of our tests they will help provide a better idea.
The testbed for Storage Bench 2011 has changed as well. We're now using a Sandy Bridge platform with full 6Gbps support for these tests. All of the older tests are still run on our X58 platform.
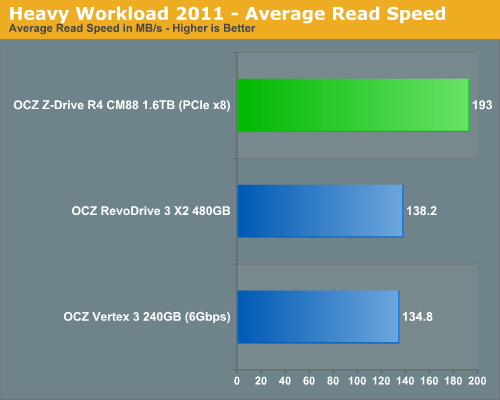
AnandTech Storage Bench 2011 - Heavy Workload
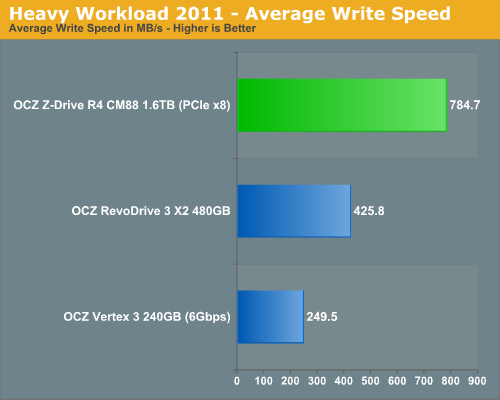
We'll start out by looking at average data rate throughout our new heavy workload test:
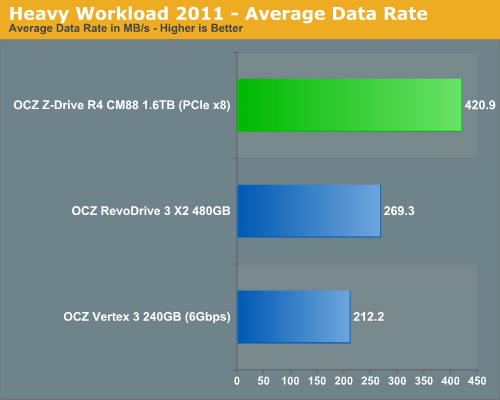
I don't expect many desktop/workstation users to buy Z-Drive R4s, but this is the fastest SSD we've tested in our AnandTech Storage Bench 2011 suite. Note the imperfect scaling from 4 to 8 controllers however, the increase over the RevoDrive 3 X2 is only 56%. Even with a strenuous desktop workload it's tough to fully load all 8 controllers in the Z-Drive R4.
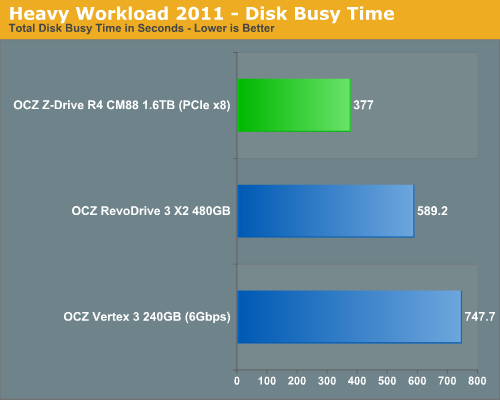
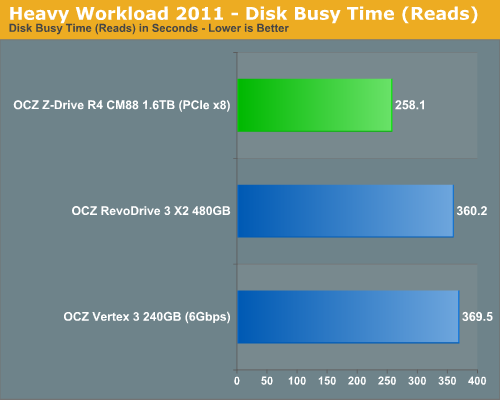
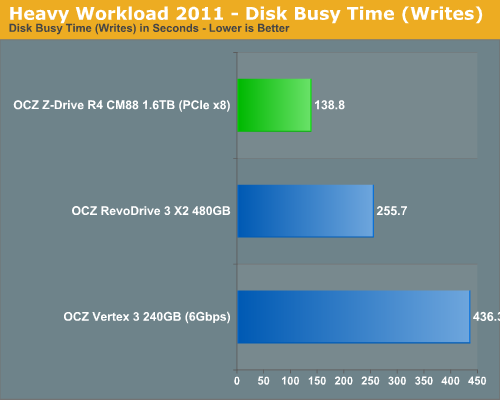
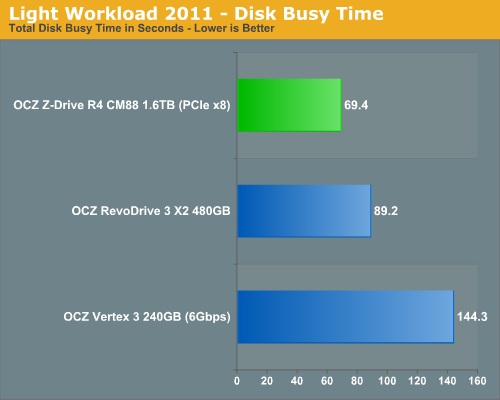
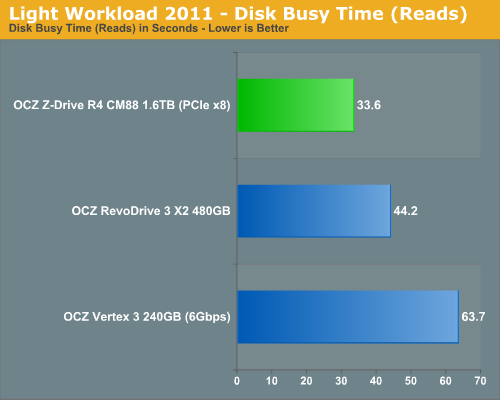
The next three charts just represent the same data, but in a different manner. Instead of looking at average data rate, we're looking at how long the disk was busy for during this entire test. Note that disk busy time excludes any and all idles, this is just how long the SSD was busy doing something:
AnandTech Storage Bench 2011 - Light Workload
Our new light workload actually has more write operations than read operations. The split is as follows: 372,630 reads and 459,709 writes. The relatively close read/write ratio does better mimic a typical light workload (although even lighter workloads would be far more read centric).
The I/O breakdown is similar to the heavy workload at small IOs, however you'll notice that there are far fewer large IO transfers:
| AnandTech Storage Bench 2011 - Light Workload IO Breakdown | ||||
| IO Size | % of Total | |||
| 4KB | 27% | |||
| 16KB | 8% | |||
| 32KB | 6% | |||
| 64KB | 5% | |||
Despite the reduction in large IOs, over 60% of all operations are perfectly sequential. Average queue depth is a lighter 2.2029 IOs.
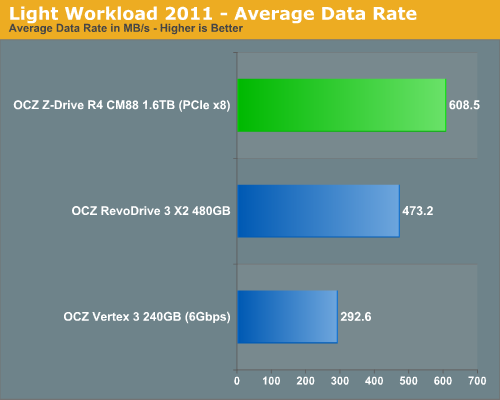
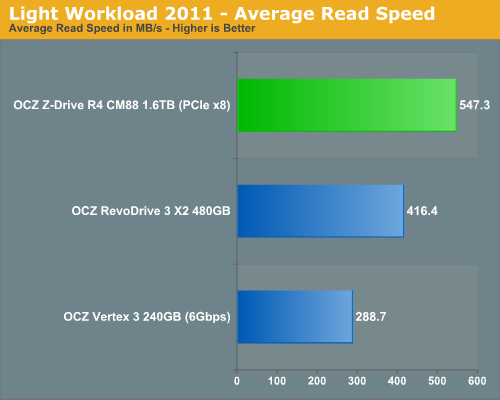
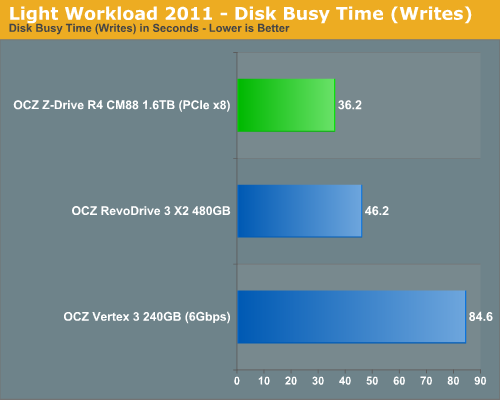
The performance advantage over the RevoDrive 3 X2 drops to around 29% in our lighter workload. The narrowing gap makes sense given the workload here. There's less to break up and distribute among all of the controllers and thus we see less of a speedup.

Enterprise Storage Bench - Oracle Swingbench
We've been toying with the idea of bringing enterprise performance tests to our SSD reviews for over a year now. We had expected to have more time to launch the suite but the Z-Drive R4 (and another enterprise SSD) were dropped on us unexpectedly so we had to rush things a bit. By no means is this the extent of our enterprise storage bench, but it's a start.
We begin with a popular benchmark from our server reviews: the Oracle Swingbench. This is a pretty typical OLTP workload that focuses on servers with a light to medium workload of 100 - 150 concurrent users. The database size is fairly small at 10GB, however the workload is absolutely brutal.
Swingbench consists of over 1.28 million read IOs and 3.55 million writes. The read/write GB ratio is nearly 1:1 (bigger reads than writes). Parallelism in this workload comes through aggregating IOs as 88% of the operations in this benchmark are 8KB or smaller. This test is actually something we use in our CPU reviews so its queue depth averages only 1.33. We will be following up with a version that features a much higher queue depth in the coming weeks.
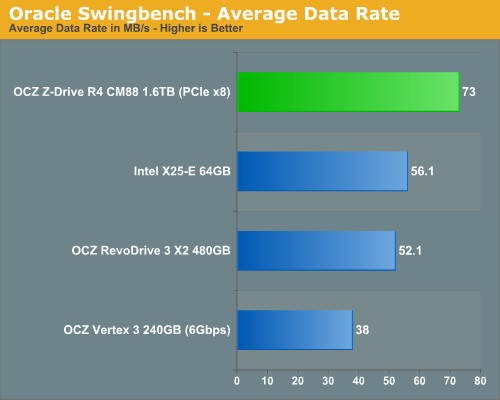
Surprisingly enough the SF-2281 based drives don't actually do all that well here. A single Vertex 3 is only good for 38MB/s, while the old X25-E manages 56.1MB/s. The Z-Drive R4 is the fastest drive here but only by 30% margin.

The same results are reflected if we look at disk busy time. However as I mentioned before, this benchmark features a very low average queue depth. With only one IO running most of the time you're not going to see much of a difference between multi-controller and single-controller drives. Despite this fact there's still a 90%+ advantage the Z-Drive R4 enjoys over a single Vertex 3, implying that there are periods of extremely high queue depths that are simply being hidden in the average. In order to see how well the drive does in these periods of very heavy IO activity we need to look at another metric: average service time.
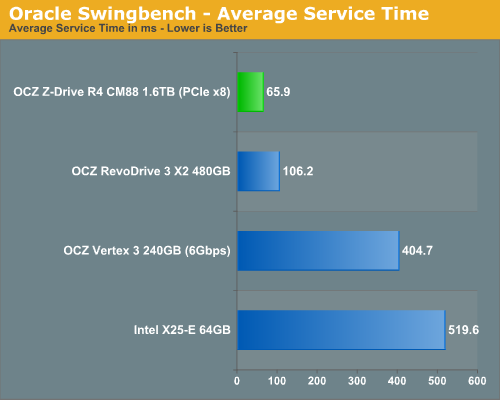
Average data rate and disk busy time tell us how much data is moved but they don't tell us how quickly each stacked IO completes. Average service time gives us this data. Here we see huge performance advantages for the SF-2281 drives, and the Z-Drive R4 is significantly faster than even the RevoDrive 3 X2.
Both metrics are important - one gives you an idea of average performance while the other illustrates how the drive performances under heavy load.
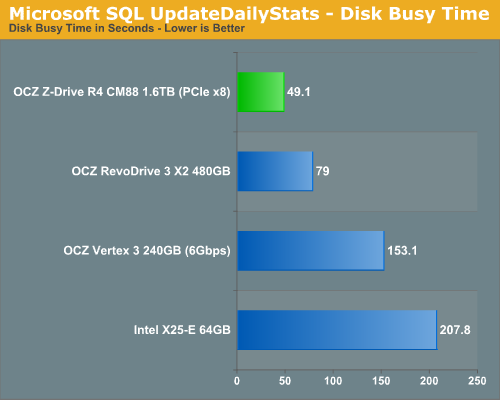
Enterprise Storage Bench - Microsoft SQL UpdateDailyStats
Our next two tests are taken from our own internal infrastructure. We do a lot of statistics tracking at AnandTech - we record traffic data to all articles as well as aggregate traffic for the entire site (including forums) on a daily basis. We also keep track of a running total of traffic for the month. Our first benchmark is a trace of the MS SQL process that does all of the daily and monthly stats processing for the site. We run this process once a day as it puts a fairly high load on our DB server. Then again, we don't have a beefy SSD array in there yet :)
The UpdateDailyStats procedure is mostly reads (3:1 ratio of GB reads to writes) with 431K read operations and 179K write ops. Average queue depth is 4.2 and only 34% of all IOs are issued at a queue depth of 1. The transfer size breakdown is as follows:
| AnandTech Enterprise Storage Bench MS SQL UpdateDaily Stats IO Breakdown | ||||
| IO Size | % of Total | |||
| 8KB | 21% | |||
| 64KB | 35% | |||
| 128KB | 35% | |||
With much larger transfer sizes, we expected to see some much bigger numbers out of the Z-Drive R4:
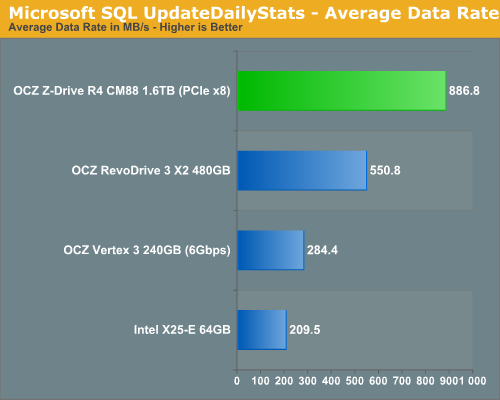
Indeed average transfer speeds are up significantly. The Z-Drive R4 is over 61% faster than the RevoDrive 3 X2 and more than 3x the speed of a single Vertex 3.
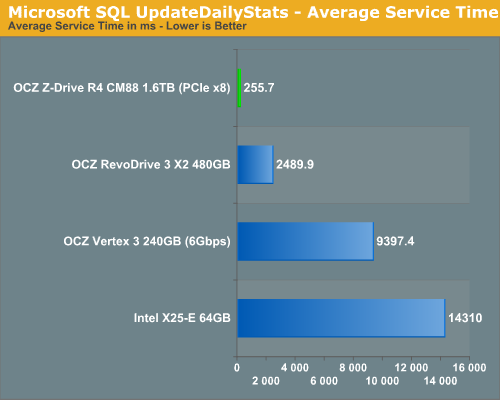
A look at average service time paints an even more dramatic picture. During periods of extremely high queuing the Z-Drive R4 is over an order of magnitude faster (36x faster) than a single drive. The most surprising is the comparison to the RevoDrive 3. As we implied earlier, it looks like there may be some additional firmware goodness in the Z-Drive R4 that gives it the edge over the RevoDrive 3 X2.
Enterprise Storage Bench - Microsoft SQL WeeklyMaintenance
Our final enterprise storage bench test once again comes from our own internal databases. We're looking at the stats DB again however this time we're running a trace of our Weekly Maintenance procedure. This procedure runs a consistency check on the 30GB database followed by a rebuild index on all tables to eliminate fragmentation. As its name implies, we run this procedure weekly against our stats DB.
The read:write ratio here remains around 3:1 but we're dealing with far more operations: approximately 1.8M reads and 1M writes. Average queue depth is up to 5.43.
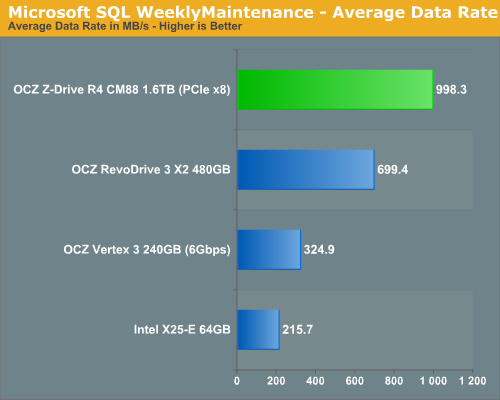
We don't see perfect scaling going from 4 to 8 controllers but the performance gains are tangible: +42% over the RevoDrive 3 X2 and nearly 3x the performance of a single Vertex 3.

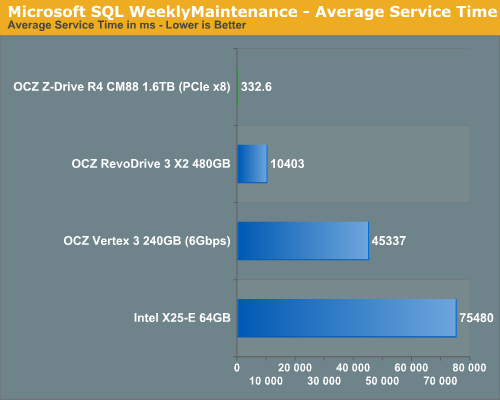
Average service time continues to be where the Z-Drive R4 really dominates. The use of 8 controllers in parallel appears to be able to significantly reduce average service times when queue depths skyrocket. The R4 CM88 is now over two orders of magnitude (136x) faster than a single Vertex 3—and 227x faster than the Intel X25-E. Again we see that the RevoDrive 3 X2 is much slower than it should be here, possibly pointing at a firmware bug or some other enhancement on the Z-Drive R4.
Final Words
Without competing cards to compare to it's difficult to quantify the Z-Drive R4's performance other than to say that it is obviously very fast. With SandForce based SSDs however my concern is rarely about performance and more about reliability. I've often heard that in the enterprise world SSDs just aren't used unless the data is on a live mechanical disk backup somewhere. Players in the enterprise space just don't seem to have the confidence in SSDs yet. Given the teething problems we've seen on the desktop, I don't blame these customers at all.

Ultimately that's my biggest concern with the Z-Drive R4: it seems to be a very solid performer, but it has an absolutely unknown reliability track record. It's possible that by using an on-board SAS controller the Z-Drive R4 will be less prone to random system incompatibilities and a more reliable solution since it is effectively a closed box at that point. That's purely speculation however.
I am curious how OCZ will approach enterprise customers and attempt to win over their trust with the Z-Drive R4. You obviously won't see any Newegg reviews of the product, so OCZ will have to get testimonials from some pretty influential customers to gain traction in this space.
Seriously entering the enterprise market is a huge move for OCZ. Three years ago I couldn't have predicted OCZ would get this far, I wonder what will happen over the next three. One thing is for sure: OCZ will need more than enterprise products to adequately address this market. Hopefully any investments in testing and validation for enterprise customers will help improve the consumer side of the business as well.


